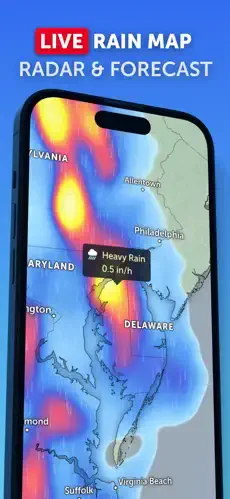
Zoom Earth does something most weather apps never attempt.
Zoom Earth shows you the sky instead of just describing it. Satellite imagery refreshes every ten minutes. Storm systems move across your screen in near real time. Hurricanes, wildfires, wind patterns and rain cells appear as living, shifting visuals rather than static numbers on a card.
The app comes from Neave Interactive and is free to download with an optional Pro subscription. On the App Store, it holds a 4.8 out of 5 rating from 39,000 ratings and ranks seventh in the Weather category at the time of research. The download size sits around 56.3 MB on iOS , and the age rating is 4+ on the App Store.
Most Weather Apps Tell You Numbers. This One Shows You the Sky.
The Problem With Standard Forecasts
Every phone has a weather app. Most show a temperature, a rain percentage and a small icon. That works until you need to understand what is actually happening above you. A 40 percent chance of rain tells you almost nothing about whether a passing shower will last ten minutes or a storm will wash out your entire afternoon.
The gap between data and understanding is where most weather apps fail. They hand you numbers and expect you to interpret them. They do not show you the cloud band moving toward your city. They do not let you watch a hurricane curve out to sea or turn toward the coast. They do not reveal that the rain you are worried about is already breaking apart fifty miles west.
Zoom Earth fills that gap. It treats weather as a visual system you can watch, pause, rewind and inspect from a global view down to your neighborhood.
What the App Actually Is
Zoom Earth is a weather map built by Neave Interactive. It layers satellite imagery, radar, forecast models, hurricane tracking, wildfire detection and atmospheric data into a single interactive globe. You zoom. You pan. You move through time. You switch layers. Everything stays on one screen.
The app draws from established meteorological sources. NOAA GOES satellites cover the Americas. JMA Himawari covers East Asia, Oceania and the Pacific. EUMETSAT Meteosat covers Europe, Africa and the Atlantic. NASA Aqua and Terra add higher detail imagery twice daily. Ground-based Doppler radar handles precipitation. NASA FIRMS tracks active fires and heat spots.
That combination is why Zoom Earth stands apart. It is not a forecast app with a map bolted on. It is a map with weather intelligence built into every layer.
Why It Matters for Real Decisions
Rhetorical question. When was the last time a standard weather app helped you decide whether to wait twenty minutes before leaving the house?
Zoom Earth answers questions that matter in the moment. Is that rain band going to reach me before I finish my run? Are wind gusts strong enough to make cycling dangerous today? Is the smoke from that wildfire drifting toward my town? Is the hurricane forecast track reliable or is the storm still organizing?
The app does not guess. It shows you the data and lets you draw conclusions. That shift from passive consumption to active understanding is the reason it earns its place on your home screen.
What Zoom Earth Does Differently
Why the Map Changes Everything
Weather is movement. Clouds form, shift and dissolve. Rain bands stretch and break apart. Hurricanes spin across oceans for days. A static forecast icon cannot capture any of that. A map can.
Satellite imagery updates every ten minutes from geostationary satellites covering most of the populated world . NASA polar orbiting satellites add higher resolution views twice daily. Radar layers show precipitation detected by ground based systems. Nowcasts estimate where rain is heading in the next hour based on current radar data.
You press play. The clouds move. A storm cell drifts east. A smoke plume stretches north. The system that looked threatening on a forecast card either builds into something serious or falls apart before reaching you. You see it happen.
The Layers That Matter Most
Wind speed tells you average conditions. Wind gusts tell you what will actually knock you off balance. Zoom Earth offers both and the gust layer is the one worth checking before any outdoor plan.
Temperature gives you a number. Feels like temperature tells you what your body will experience. Wet bulb temperature reveals heat stress risk when humidity prevents sweat from cooling you effectively. Dew point gives a clearer picture of how muggy the air feels than relative humidity alone .
Pressure maps show where low and high pressure systems sit. Low pressure often brings unsettled weather. High pressure tends to bring calmer conditions. Watching pressure patterns shift tells you more about what is coming than any single forecast.
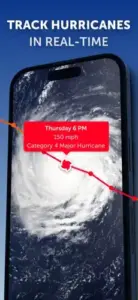
Hurricane tracking pulls from NHC, JTWC, NRL, and IBTrACS. You see the storm’s current position, forecast track, and intensity information in a visual format that makes more sense than a table of coordinates.
Wildfire and smoke monitoring uses NASA FIRMS data and GeoColor imagery. Active fire detections appear as heat spots. Smoke plumes show up in satellite views. If you live in a fire prone region, this layer alone justifies the download.
Free Versus Pro Without the Spin
The free tier gives you most of what makes Zoom Earth useful. Satellite imagery, radar, wind layers, temperature and hurricane tracking all work without paying. Ads appear in the free version and they are noticeable but not constant.
Pro subscriptions are listed at $1.99 and $11.99. The differences are straightforward. Pro adds forecast maps up to ten days, radar nowcasting up to one hour, tropical weather alerts, ad removal and account based access across supported devices.
Casual users checking weather a few times a week will find the free tier sufficient. Storm trackers, outdoor professionals, sailors, pilots and anyone who lives in hurricane country may find the alerts and extended forecasts worth the cost. The decision comes down to how often you rely on the app for decisions that matter.
Zoom Earth Tips
The Zoom Earth app rewards users who take a few minutes to learn what each layer actually does. You do not need a meteorology background. You need to know which tool answers which question. Here is what genuinely helps.
Use radar for immediate rain decisions. When you need to know whether rain will reach you in the next thirty minutes, radar beats any daily forecast. Look at the direction and speed of cells moving toward your location. A 40 percent chance of rain means nothing if the radar shows the band breaking apart twenty miles west of you.
Use nowcasts for the next hour when radar coverage exists. Nowcasts estimate where precipitation is heading based on current radar data. Pro extends this to one hour. Treat it as a helpful estimate, not a guarantee. Coverage varies by region, so do not rely on nowcasts in areas with sparse radar infrastructure.
Check wind gusts, not just average wind speed. The gust layer reveals what will actually affect cycling, boating, hiking, construction work or driving a high profile vehicle. Average wind might read 12 mph while gusts hit 35. That difference matters when you are deciding whether to head out.
Compare actual temperature with feels like temperature. Heat stress and cold discomfort depend on humidity, wind and other factors. The feels like layer captures that better than the raw number. A 90 degree day with high humidity feels worse than a dry 100 degree day in the desert.
Use dew point for a clearer picture of how muggy air feels. When dew point climbs above 65 degrees Fahrenheit, the air feels sticky. Above 70, it feels oppressive. This measure tells you more about comfort than relative humidity, which changes with temperature even when moisture stays constant.
Check wet-bulb temperature during heat waves. When wet bulb temperature approaches human body temperature, sweat stops cooling you effectively. This layer is critical for outdoor workers, athletes and anyone in extreme heat. It is the difference between uncomfortable and dangerous.
Follow hurricanes as a system, not a single line on a map. Watch the satellite animation. Check the wind field. Look at pressure. The forecast cone shows uncertainty, not certainty. A storm can shift fifty miles in either direction within twelve hours. Always follow official local warnings for evacuation decisions.
Watch satellite animation to understand storm direction. Is the system approaching, stalling, organizing or falling apart? Movement over time answers that question in ways a single image cannot. Press play and watch the last few hours of cloud motion.
Monitor active fires and smoke imagery together. Fire detections show where heat spots exist. Smoke plumes in satellite imagery show where that smoke is drifting. If you have respiratory issues or live downwind of fire prone regions, this combination matters.
Use pressure maps for broader context. Falling pressure often signals approaching unsettled weather. Rising pressure suggests clearing. Watching these patterns shift gives you a sense of what is coming before the clouds arrive.
Create saved locations for people and places you monitor. Add labels for home, parents, the beach house, a job site, or a flight route. Quick access to multiple locations saves time when you check the app throughout the day.
Enable Crosshair Mode to inspect exact points between city labels. When a location sits between city labels or near a coastline, crosshair mode lets you read conditions at that precise spot. This is useful for hiking trails, remote job sites and coastal areas without a nearby city marker.
Use the coordinate grid for advanced tracking. Coordinates and pressure values on isolines help students, weather enthusiasts, sailors and pilots compare Zoom Earth data with official advisories. If you cross reference forecasts from multiple sources, the grid makes that easier.
Set your units correctly before relying on the app for decisions. Choose Celsius or Fahrenheit, km/h or mph or knots and your local time zone. A wind speed reading in the wrong unit can turn a manageable breeze into what looks like a dangerous gale.
Check official alerts separately for tornadoes, hurricanes, floods, and wildfire evacuations. Zoom Earth is excellent for visual analysis. It is not a replacement for emergency warnings. Always use official sources for life safety decisions.
Zoom Earth Similar Apps
Zoom Earth similar apps cover a range of specialties. Some focus on wind and marine conditions. Some emphasize alerts. Some provide professional grade meteorological tools. Here is how the major alternatives compare.
| App | Best For | Main Difference from Zoom Earth |
|---|---|---|
| Windy.com | Advanced wind, waves, aviation, sailing | More specialist layers and model comparison; Zoom Earth is simpler for satellite and hurricane visualization |
| Ventusky | Animated weather maps | Similar visual approach; interface and layer selection differ |
| Clime | Radar, tornado, rain, storm alerts | More alert focused for local weather; Zoom Earth is stronger for global satellite tracking |
| My Hurricane Tracker | Hurricane and tornado alerts | Focused on tropical notifications; Zoom Earth offers broader weather layers |
| National Hurricane Center Data | Official NHC hurricane tracking | Specialized around NHC data; Zoom Earth combines tropical data with satellite, radar and fire layers |
| PredictWind | Marine weather, routing, forecasts | Better for sailors and offshore users; Zoom Earth is more general purpose |
| Windfinder | Wind, tide, wave forecasts | Better for wind sports and coastal users |
| Weather Live | Local forecast, widgets, daily planning | Better for conventional phone weather use; Zoom Earth is more map centric |
| Apple Weather | Simple local forecasts and alerts | Better for lightweight daily use; less detailed for satellite and global systems |
| Google Earth | Geographic exploration and historical imagery | Better for terrain and place research; Zoom Earth is purpose built for current weather |
If you want a dedicated marine and wind focused tool, Windy.com is worth a look. It offers deeper model comparison and specialist layers for sailing and aviation. Zoom Earth remains the stronger choice for satellite imagery, hurricane tracking and wildfire monitoring in one place.
Zoom Earth occupies a specific middle ground. It is more visual than standard forecast apps. It is more accessible than professional meteorological tools. It is stronger for satellite and hurricane tracking than most alternatives.
Conclusion
Most weather apps tell you numbers. This one shows you the sky.
Zoom Earth rewards users who want to understand weather systems, not just react to them. It punishes anyone expecting a simple widget or a replacement for official emergency alerts. The layers can overwhelm. The free tier has ads. The learning curve is real.
But if you spend time outdoors, follow storms, live in hurricane country or simply want to see what is coming before it arrives, this is one of the best free tools available. The satellite imagery alone makes it worth the download. The hurricane tracker, wildfire monitoring and wind layers turn it into something you will check daily.
Download it. Open the map. Find your location. Watch the clouds move.
Frequently Asked Questions About Zoom Earth
Where can I find the official Zoom Earth download for my device?
Zoom Earth app is available on the App Store for iOS. For desktop browsers, the full map experience runs directly from the official Zoom Earth website. The developer, Neave Interactive, also maintains a Wikipedia page with background on the company and its projects.
Is Zoom Earth free, or do I need a subscription?
The core app is free with ads. A Pro subscription is listed at $1.99 and $11.99. Pro adds forecast maps up to ten days, radar nowcasting up to one hour, tropical weather alerts, ad removal and account based access across supported devices. Casual users checking weather a few times a week will find the free tier sufficient. Storm trackers, sailors and anyone in hurricane country may find Pro worthwhile.
Can Zoom Earth replace official weather alerts during a hurricane?
No. Zoom Earth is a visual analysis tool, not an emergency warning system. It pulls hurricane data from NHC, JTWC, NRL and IBTrACS, and it shows forecast tracks, wind fields and satellite imagery in a format that makes storm behavior easier to understand. But for evacuation orders, tornado warnings, flood alerts and wildfire evacuation notices, always follow official local authorities. The app works best alongside those sources, not instead of them.
What makes Zoom Earth different from a standard weather app?
Standard weather apps hand you numbers. Zoom Earth shows you the sky. Satellite imagery refreshes every ten minutes from NOAA GOES, JMA Himawari and EUMETSAT Meteosat. Radar, nowcasts, wind gusts, wet bulb temperature, pressure maps, wildfire detection and smoke monitoring all layer onto a single interactive globe. The result is a tool that answers questions like “Is that rain band going to reach me before I finish my run?” in ways a 40 percent chance of rain never can.